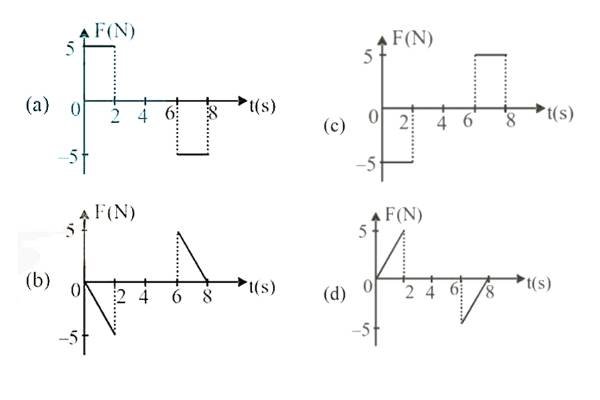
The momentum p of an object varies with time (t) as shown in figure. The corresponding force (F)-time (t) graph is

 .
.
- A
Graph (a)
- B
Graph (b)
- C
Graph (c)
- D
Graph (d)
✓ Correct answer: A
Want the full step-by-step reasoning?
NewNcert › Physics › Laws of Motion
The momentum p of an object varies with time (t) as shown in figure. The corresponding force (F)-time (t) graph is
.
Graph (a)
Graph (b)
Graph (c)
Graph (d)
Want the full step-by-step reasoning?
Question ID #432437 · NewNcert